What is Dart?
Data Analysis & Reporting Tool or DART allows users to search NOACA-centric data in an easy to use custom online mapping application. It performs computational analysis by aggregating large data sets into five different "themes" based on the mission of NOACA, highlighting the most important attributes for each. DART will help inform the public about a selected area by providing quick data summaries and reports, as well as GIS data and spreadsheets. These exportable pieces of information can then be used in the planning process to make more informed, data driven decisions or as part of a larger study or analysis.
As a Regional Planning Organization, NOACA is a valuable source of GIS information for the counties, communities and individuals from within the area it serves. DART will make this information easier to find and consume by aggregating data and allowing for users to query, analyze and output the results. DART will support NOACA's vision, by providing decision makers with the data they need to plan more effectively
To use Dart you must log in with a Dart account. To request an account contact the Dart administrator.
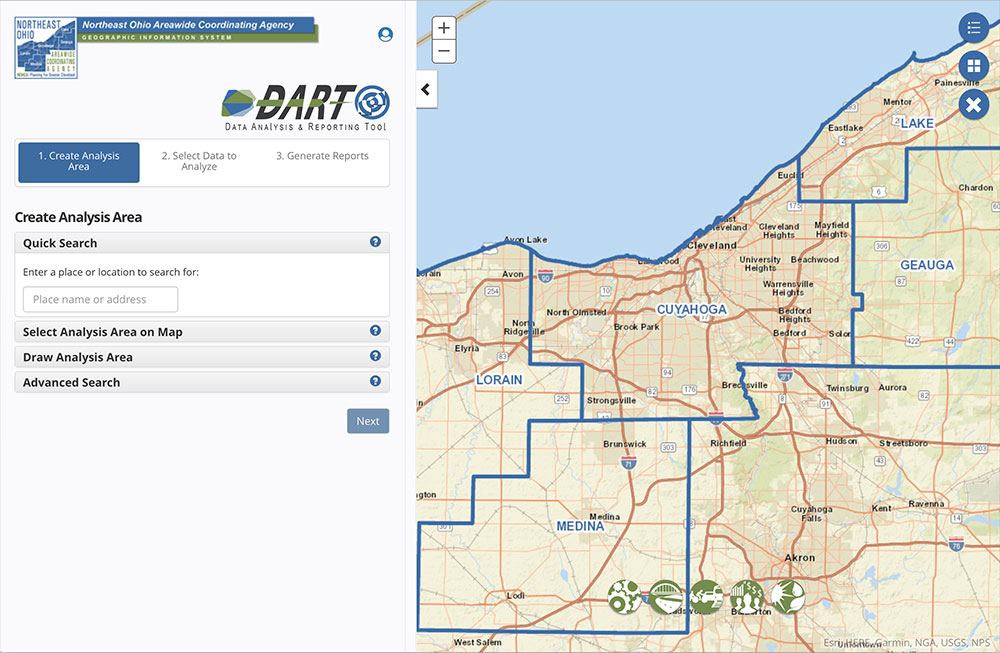
The Dart interface has two primary sections: a map on the right with toolf for navigation and map display, and the reporting tools panel on the left.
Map Tools
The map includes numerous tools to navigate and and interact with NOACA's GIS data.
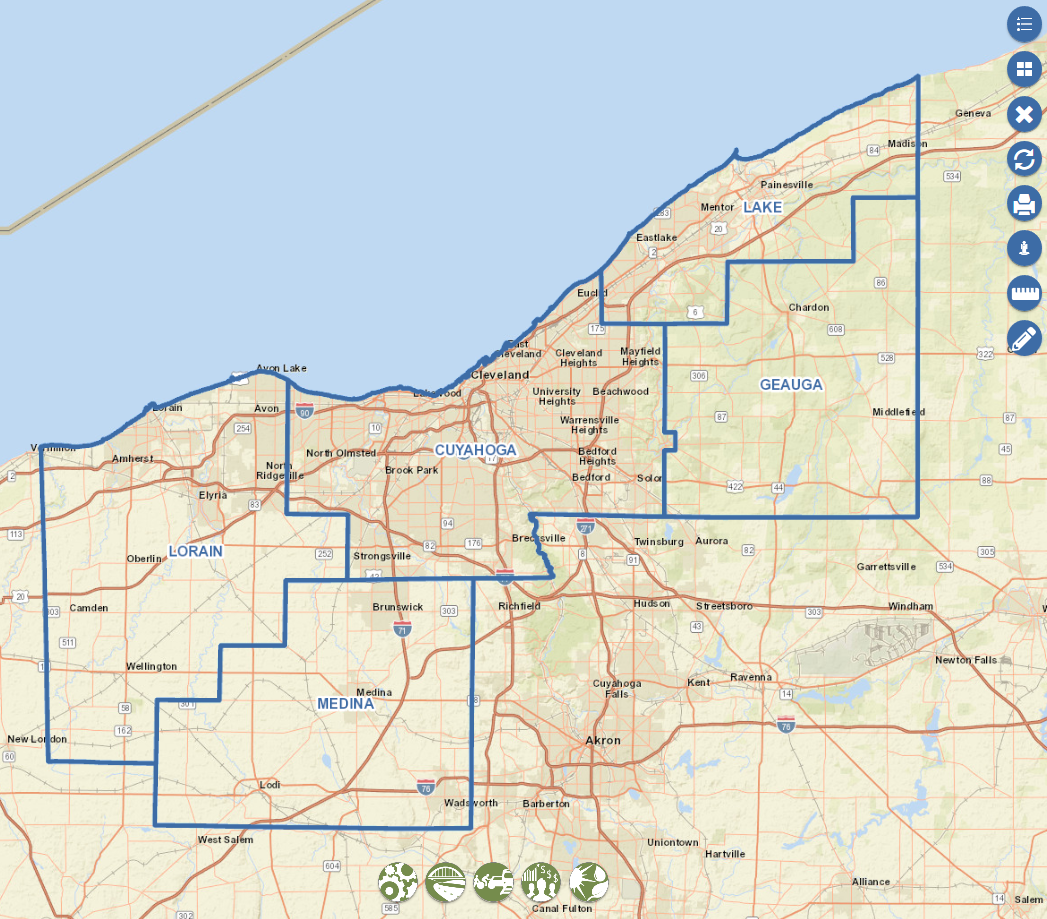
The map opens showing the NOACA region and county boundaries. Map tools along the right side of the map provide various utility functions. The five icons along the bottom of the map allow you to toggle map layers on and off. Map layers are grouped into five menues to alogn with the NOACA mission.
Create an Analysis Area
The first step in using Dart is to create an analysis area. Dart provides numerous options for you. For example you might want to analysis a particular zip code or draw your own study area.
Quick Search
Use this search function to find an address or place name on the map. Type in an address or location name in the search box and DART will zoom you to it and place a point on the map. Once you're there, you can create a buffered selection area around it, or use one of the other methods to create your analysis area.
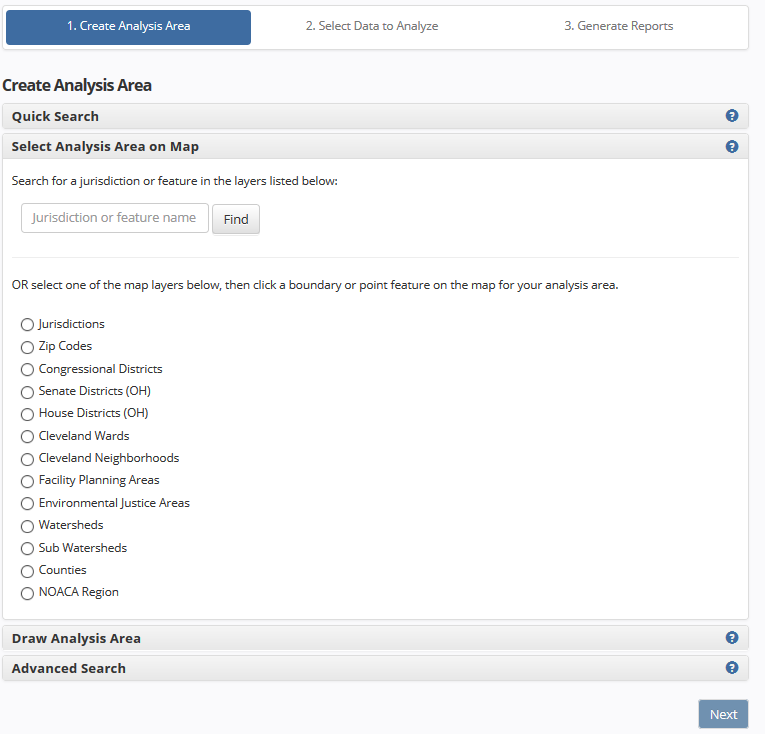
Select Analysis Area on Map
Use this search function to find specific feature names from the list of searchable map layers in DART. Type in a jurisdiction name or another keyword and choose one of the features found. Or you can turn on a specific map layer from the list and simply click the feature you want to use for your analysis area.
Draw Analysis Area
Use this search function to create your own analysis area. You can simply place a point anywhere on the map and then select a distance to buffer around that point in a circle. Or draw a line onto of the map to trace a specific path or corridor and then select a distance to buffer around it. Or draw a more complex polygon around an area of interest to use as the analysis area.
Advanced Search
You may upload a shapefile to create your selection area. Keep these requirements in mind:
- Zip file must contain at least 3 files, all with same name except for extension: .shp, .shx and .dbf files.
- Coordinates must be in latitude/longitude (WGS84), or contain a projection (.prj) file.
- Limit of 1 MB on uploaded zip file.
- Zip file must not require any password.
- Only the first 20 features will be read from the shapefile.
- Upload begins immediately after selecting/dropping file!